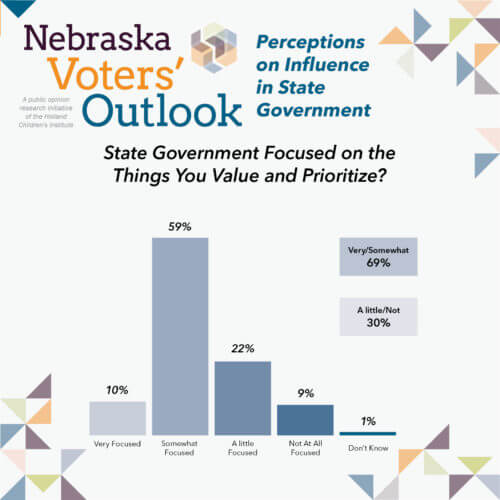
“Nebraska Voters’ Outlook” is a public opinion research initiative of the Holland Children’s Institute. We are sharing findings from a statewide public opinion survey commissioned late this summer. The first release in the Nebraska Voters’ Outlook series reveal Nebraskans have cynical views on who and what is influencing decisions in state government.
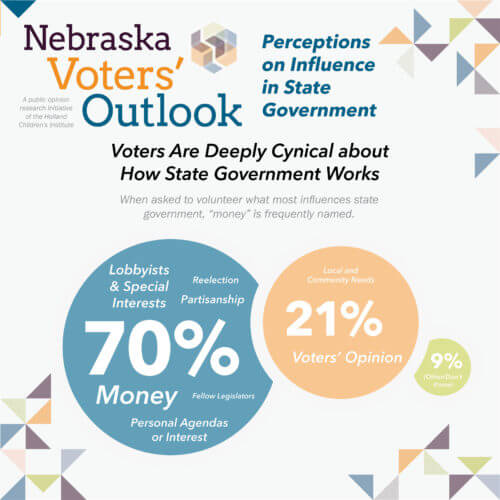
When asking voters to volunteer answers on what most influences decision making in state government, 70% of respondents offered a cynical answer like money, special interests, personal agendas or partisanship.
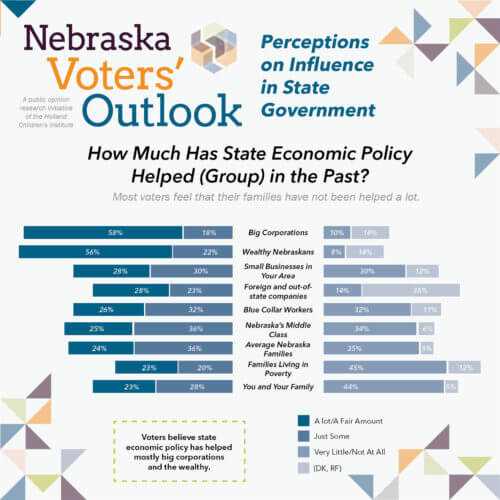
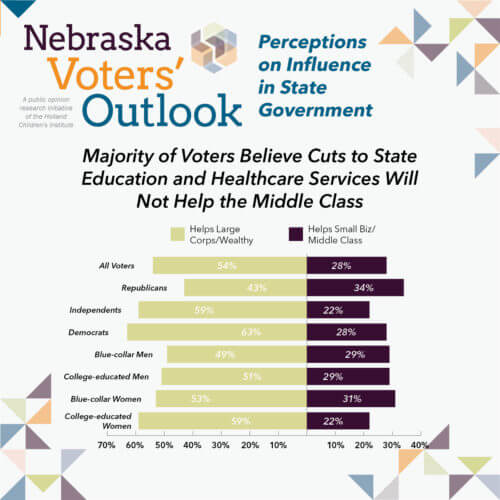
There is a stark difference between what groups Nebraska voters indicate they feel have been helped by state economic policies. Those surveyed indicate they believe state economic policies have helped the following groups a lot or fair amount by these margins: big corporations (58 percent), wealthy Nebraskans (56 percent), blue collar workers (26 percent), Nebraska’s middle class (25 percent), average Nebraska families (24 percent), families living in poverty (23 percent), and you and your family (23 percent). Overall, regardless of party, gender, or education more Nebraskans (54 percent) think cuts to state services will harm their families and instead, benefit big business and the wealthy.
From Our CEO, Hadley Richters:
“The first release of results show Nebraskans don’t believe they have influencing power in state government. They believe state government is working mostly to help large corporations and the wealthiest in Nebraska. We believe it’s important this research on public opinion in Nebraska is made available and accessible, especially to those making decisions on the issues impacting the lives of children and working families.”
About the methodology:
TargetSmart designed and administered this telephone survey conducted by professional interviewers. The survey reached 600 adults, age 18 or older, who indicated they were registered to vote in Nebraska. The survey was conducted from July 25-29, 2018. The sample was randomly selected from TargetSmart’s enhanced voter file. The data were weighted by gender, age, party registration, and region by congressional district to ensure an accurate reflection of the population. The overall margin of error is ±4.0%. The margin of error for subgroups is larger and varies. Percentage totals may not add up precisely due to rounding.
